We use strictly necessary cookies and — only with your consent — analytics cookies to improve your experience and measure how our content performs. You can accept everything, reject everything, or choose in detail. More information in the Privacy Policy and in the Cookie Policy .
Cookie preferences
Choose which categories to allow. You can change your preferences at any time from the "Manage cookie preferences" link in the site footer.
Strictly necessaryAlways on
Technical cookies essential to the operation of the site (security, and storing your own privacy choices). They cannot be disabled.
Store your personalisation choices (language, currency, layout) so your next visits are consistent.
Measure how you use the site, in aggregate form (Google Analytics 4, Core Web Vitals). They help us understand which content works.
Would serve personalised ads and measure the effectiveness of campaigns on other sites. No technology in this category is currently active: it stays here so that nothing can be switched on in future without an explicit choice by you.
April to October carries 80 percent of Pompeii's visitors, and August is no busier than May. Eight years of the Park's monthly counts, the 20,000 cap and the free-Sunday rules.
Photo: Freepik stock via Magnific, Premium license
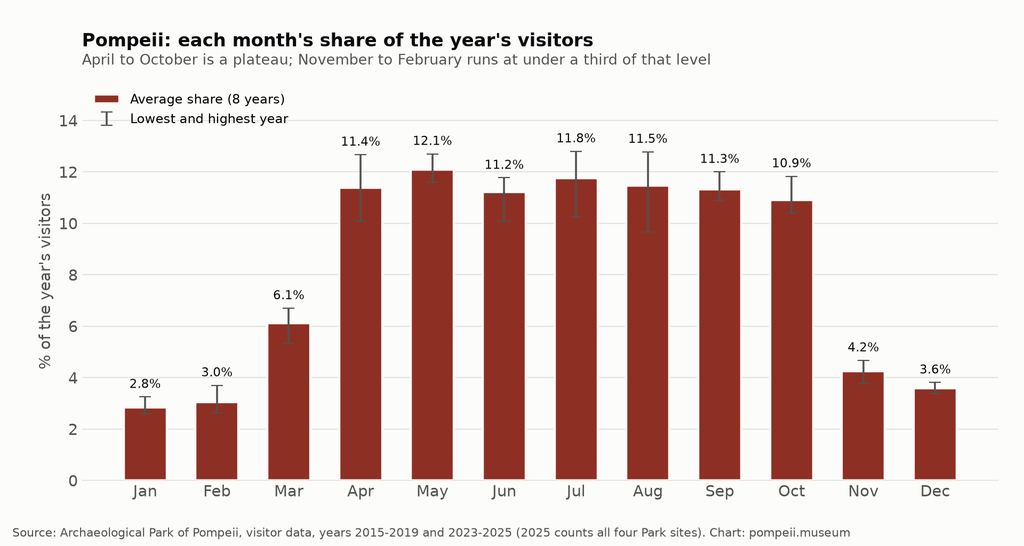
Pompeii is busy from April to October and quiet from November to March, and within the busy half the month hardly matters. Across eight years of the Park's own monthly counts, April to October carries 80 percent of a year's visitors, each of those seven months takes between 10.9 and 12.1 percent, and August (11.5 percent) is not busier than May (12.1 percent). In January the average day brings about 3,900 people; in April and May about 16,200, which is 81 percent of the 20,000-entry daily cap. Below are the numbers, the method and the gaps. pompeii.museum is an independent guide, not affiliated with the Park, the Ministry of Culture or any other body.
How we built this calendar
The Pompeii Archaeological Park is the only body that publishes monthly visitor counts for the site. The Ministry of Culture (MiC) publishes monthly figures only for the whole nation and for each region, and only annual figures for each site. Two Park sources therefore carry the whole analysis: the "Visitor data" page, which gives monthly counts for the Scavi di Pompei, and the Director-General's report on the 2025 financial statement, which gives monthly counts for the four sites of the Park (Pompeii, Oplontis, Boscoreale and Stabia) for 2024 and 2025. We downloaded both on November 5, 2026 and recalculated every figure from the raw tables.
Years used: 2015 to 2019, 2023, 2024 and 2025, eight in all. For 2015-2019 and 2023-2024 the count is the Scavi di Pompei alone. For 2025 only the four-site figure is published by month; Pompeii is 97.11 percent of that year's total (4,000,090 of 4,118,926), and using only 2015-2019 changes the monthly shares by less than one percentage point. Years left out: 2020 and 2021 (the pandemic), 2022 (a recovery year: January and February ran at about 40 percent of their 2023 level) and 2009 (the Park's monthly figures are inconsistent, with June and July showing the same number). We use each year's share of its own total, so the growth of the whole series does not distort the months.
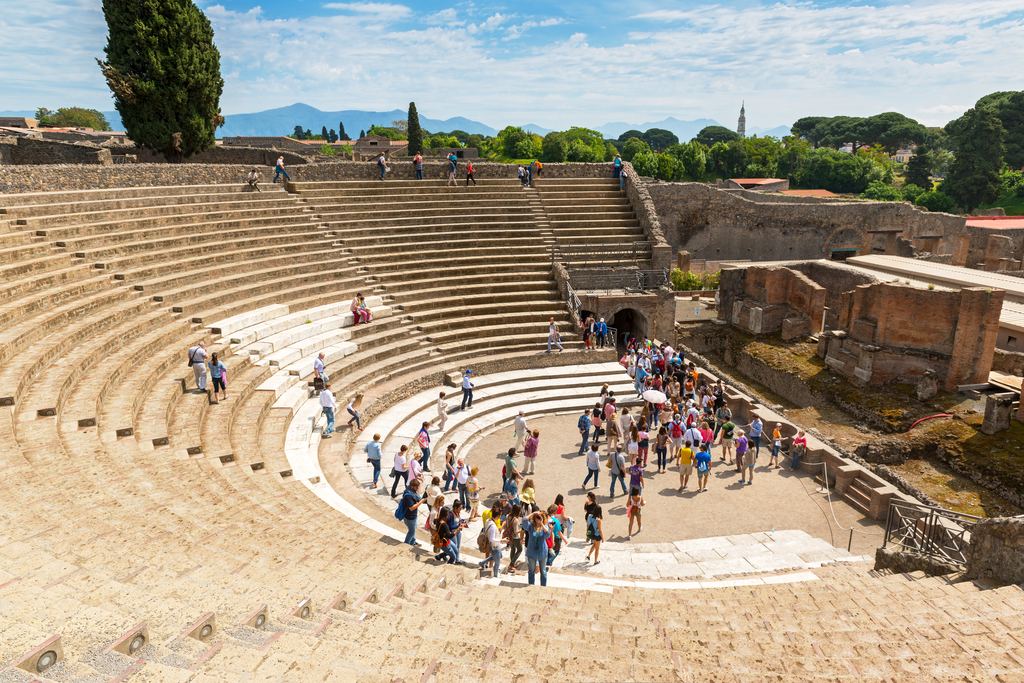
Visitors at the amphitheatre of Pompeii. · Freepik stock via Magnific, Premium license
Which months are busiest at Pompeii?
The table gives each month's average share of the annual total, the lowest and highest share in any of the eight years, and the average visitors per day in 2023-2025. The last column divides that day by the cap.
Park of Pompeii visitor data. Shares: 8-year average. Daily visitors: 2023-2025 averages (2025 is four sites).
Month
Average share of year
Range across years
Visitors a day, 2023-25
Share of 20,000 cap
January
2.84%
2.60% to 3.25%
3,860
19%
February
3.05%
2.63% to 3.70%
4,921
25%
March
6.12%
5.33% to 6.70%
8,476
42%
April
11.38%
10.07% to 12.67%
16,213
81%
May
12.09%
11.60% to 12.70%
16,198
81%
June
11.23%
10.09% to 11.77%
14,887
74%
July
11.75%
10.24% to 12.80%
14,190
71%
August
11.47%
9.67% to 12.78%
13,724
69%
September
11.33%
10.88% to 12.00%
15,092
75%
October
10.91%
10.40% to 11.83%
14,868
74%
November
4.25%
3.77% to 4.67%
6,097
30%
December
3.58%
3.39% to 3.81%
4,485
22%
Share of a year's visitors at the Scavi di Pompei by month, eight-year average with minimum and maximum. Source: Park of Pompeii. · pompeii.museum, own chart from the sources cited in the caption
Three readings follow from the table. The plateau is flat: from April to October every month lies within 1.2 points of the others. The edges are sharp: March has half of April's daily crowd, and October's is about two and a half times November's. The most stable month is December (a spread of 0.14 points in the share), and the least stable are August (9.7 to 12.8 percent) and April (10.1 to 12.7 percent). We do not explain the swings in August and April, because the Park does not.
1
2
3
4
5
6
7
8
9
10
11
12
Quietest Moderate Busy
How close does an average day get to the daily cap?
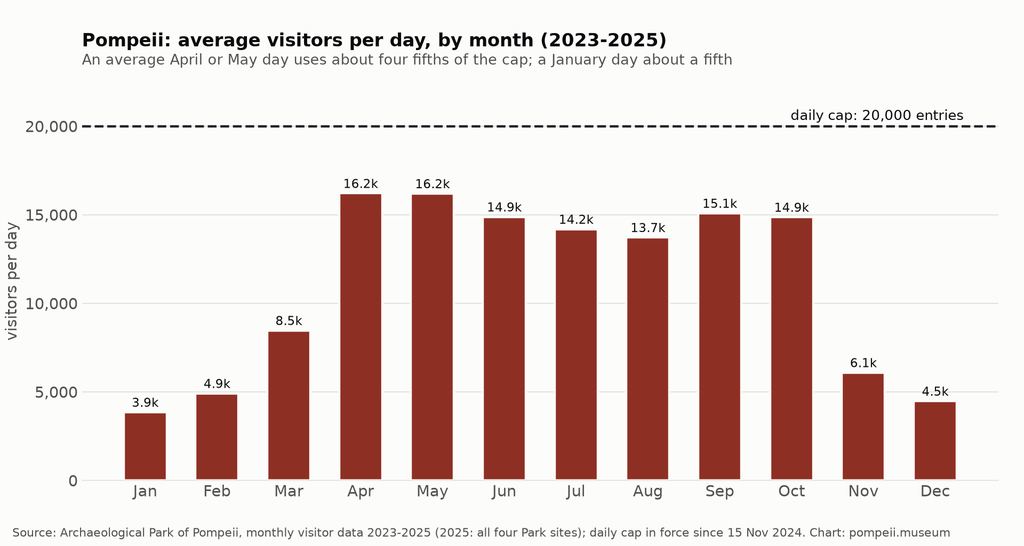
Since November 15, 2024 the Park has capped entries at 20,000 a day and issued named tickets (as of November 2026 the same limits are still on its timetable page). An average day in April and May 2023-2025 was about 16,200, or 81 percent of the cap. For the four sites in April 2025 the average was 17,400 a day; Pompeii alone, at its 97 percent share of the total, was roughly 16,900 a day, or 85 percent of the cap. An average hides the busiest days, so on many April and May days the cap is the real limit. January's average day is about 3,900, one fifth of it.
Average visitors a day by month at Pompeii, 2023-2025, against the daily cap of 20,000 entries. Source: Park of Pompeii. · pompeii.museum, own chart from the sources cited in the caption
The cap is a ceiling on one day, not a promise of room. Between April and October the average day already uses 69 to 81 percent of it.
What are the time slots and the daily cap?
The Park splits the 20,000 daily entries into two entry windows all year: up to 15,000 between 9:00 and 13:00 and up to 5,000 from 13:00 to the last entry, which is 17:30 from March 16 to October 14 and 15:30 the rest of the year (Annex A of the Park's regulation, decree 446 of December 23, 2025). The split by ticket type in the table below is published only for March 16 to October 14, on the timetable page (as of November 2026) and in the communiqué of November 14, 2024.
Summer timetable (March 16 to October 14): Park communiqué of Nov 14, 2024 and timetable page, Nov 5, 2026. No ticket-type split found for winter.
Entry window
Maximum entries
Pompeii Express
Pompeii+
9:00 to 13:00
15,000
12,000
3,000
13:00 to 17:30
5,000
3,000
2,000
Whole day
20,000
15,000
5,000
The morning band holds three quarters of the daily total, which is a fact about the allocation and not a measure of the actual queue. For the ticket types and how to book, read the ticket guide.
What happens on the first free Sunday?
State sites in Italy are free on the first Sunday of every month under the Ministry's #domenicalmuseo programme. It has produced the one crowd figure that the Park itself describes as out of scale: in its communiqué of November 14, 2024 it cited peaks of more than 36,000 entries on one of the first Sundays of summer 2024, before the cap. That is nearly twice the new cap of 20,000 and about 2.2 times the 16,000 of an average May day. No count for any individual Sunday is published in the Ministry's tables.
The rules for free days changed with the cap. In a communiqué of May 23, 2025 the Park said that on free days there is no online booking and no named ticket, that visitors go straight to the turnstiles, and that the limit of 20,000 still applies. The Ministry's own calendar entry for November 4, 2026, a free day, said "booking required", which contradicted that. Check the Park's notices before a free day. The first Sunday follows a fixed rule, so you can find it on any calendar; the open question is how entry works that day, and only the Park's notices settle it.
There is a precedent. After the crowd of May 3, 2015, the Ministry announced two time bands for Sunday June 7, 2015, from 8:30 to 12:00 and from 14:30.
What does the long record show?
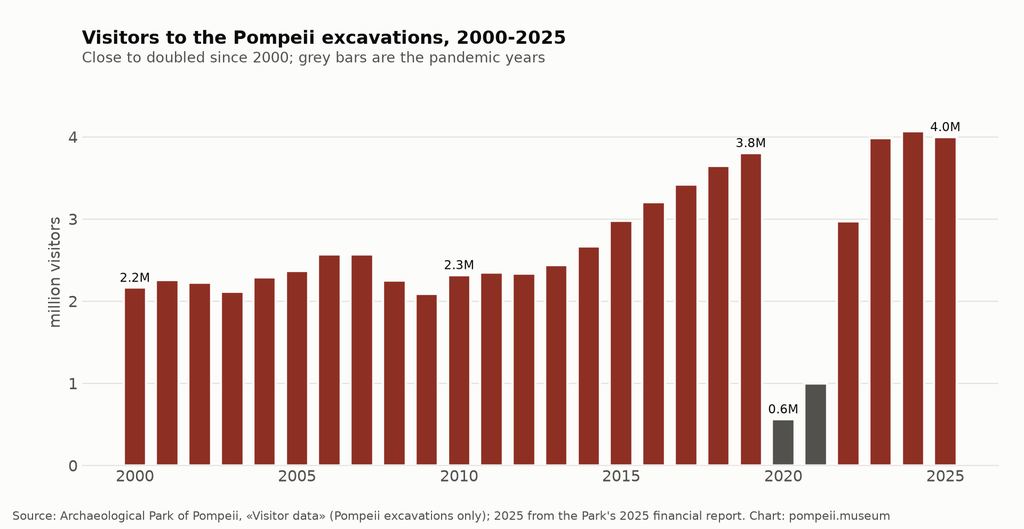
Annual counts at the Scavi di Pompei grew from 2,165,739 in 2000 to 2,978,884 in 2015 and 3,805,094 in 2019. In 2020 the count fell to 564,941, about one seventh of 2019's, and in 2021 reached 999,719. Recovery was fast: 2,972,159 in 2022, 3,985,424 in 2023 and 4,069,377 in 2024, the highest annual count in the series from 2000 to 2025. The 2025 figure is 4,000,090.
Annual visitors to the Scavi di Pompei, 2000-2025, with the fall in 2020-2021. Source: Park of Pompeii, Visitor data. · pompeii.museum, own chart from the sources cited in the caption
Month by month, 2025 looks different from 2024 in the four-site series: January was up 15.4 percent (133,788 against 115,914) while July to October ran about 7 to 10 percent lower (September down 8.4 percent, October down 9.9 percent). The Park gives no reason, and we do not offer one.
Why do websites quote different totals for Pompeii?
Because the Park and the Ministry count different perimeters. All the figures below are for 2024 and all come from public documents.
Totals for 2024 as published by the Park and the MiC. Check the perimeter before comparing.
Figure
What it counts
Source
4,069,377
Scavi di Pompei, sum of 12 monthly counts
Park, Visitor data page
4,153,910
Pompeii alone
Director-General's report, Table 1
4,137,637
Archaeological area of Pompeii, paying and free
MiC statistics, Table 9
4,177,753
All sites, as shown on the Park page
Park, Visitor data page
4,267,233
Four sites: Pompeii, Oplontis, Boscoreale, Stabia
Report, Table 1, and MiC Table 8
The only sound figure for "Pompeii" is the Scavi count, with its perimeter named. 4.27 million is the Park's four-site total, not Pompeii's. We also found two errors on the Park's own page: the total for 2007 is identical to 2008's (2,588,472), though the monthly columns of 2007 add up to about 2.93 million, and the 2009 months are inconsistent. We treated both years as unreliable.
How does Pompeii compare with the rest of Campania?
The Ministry publishes monthly counts for the region. They are a rough guide for Herculaneum, Naples or Paestum, whose own monthly numbers are not public. Campania in 2024 peaks in April, May and October; Pompeii's plateau is flatter and starts at the same time.
Campania monthly visitors 2024: MiC statistics, Table 5 (10,288,474 in the year). Pompeii: 8-year average share.
Month
Pompeii share (8-year average)
Campania visitors, 2024
Campania share
January
2.8%
431,360
4.2%
February
3.0%
507,614
4.9%
March
6.1%
862,502
8.4%
April
11.4%
1,376,008
13.4%
May
12.1%
1,273,172
12.4%
June
11.2%
995,972
9.7%
July
11.8%
852,795
8.3%
August
11.5%
910,754
8.9%
September
11.3%
976,910
9.5%
October
10.9%
1,079,998
10.5%
November
4.2%
565,180
5.5%
December
3.6%
456,209
4.4%
Annual counts for other sites show their scale, not their calendar: Herculaneum had 563,165 visitors in 2023 and 521,514 in 2024; Paestum and Velia 506,853 and 450,677; the Reggia di Caserta 934,029 and 902,410; the archaeological park of Cumae 40,510 and 25,613. The MANN had 553,141 and 532,985 (paying and non-paying together). None of these sites publishes monthly counts that we could find.
Which day of the week and which hour are quieter?
We cannot tell you, and we do not guess. The Park publishes no counts by weekday or by hour, and we found no public source that does. What the documents support is narrow: the first Sunday of the month is exceptional, and the daily allocation puts three quarters of entries before 13:00. Anything more specific is an anecdote. Our advice on timing therefore stops at the month, and the summer page covers the hours that make sense for the heat.
How to use the calendar
If your dates are fixed, read your month's row and book the earliest entry window you can. If they are flexible, choose by block first: November to March if you want space and can accept a 17:00 closing and a 15:30 last entry; April to October if you want the long summer timetable and can accept 14,000 to 16,000 other people. Between those, March gives you a closing time of 19:00 from the 16th and a crowd at half of April's. The weather side is in the climate page, the whole Bay in the month-by-month grid.
This dossier is ours. We built the shares and per-day figures from the Park's tables, they can be recomputed from the sources listed below, and where the source disagrees with itself we have said so instead of choosing a number.
Crowd questions
When is Pompeii least crowded?
From November to February. The average day brings about 6,100 people in November, 4,500 in December, 3,900 in January and 4,900 in February. March, at about 8,500, is the first month of the climb.
Is August the busiest month at Pompeii?
No. August takes 11.5 percent of a year's visitors on average, against 12.1 percent for May and 11.8 percent for July. Over eight years its share ranged from 9.7 to 12.8 percent, the widest swing of any month.
Is Pompeii crowded in October?
Yes. October averages 10.9 percent of the year and about 14,900 visitors a day, 74 percent of the cap. It is the last month before the winter timetable begins on October 15.
Is Pompeii busy in December?
No. December takes 3.6 percent of the year, about 4,500 a day, and is the most stable month in the record.
Is the first Sunday of the month really free?
Yes at state sites in Italy, including Pompeii, under #domenicalmuseo. The Park said in May 2025 that free days mean direct access at the turnstiles with no booking and no named ticket. Check its notices before you go.
How many people can enter Pompeii in a day?
20,000, since November 15, 2024. All year, 15,000 of them enter between 9:00 and 13:00 and 5,000 from 13:00 to the last entry (as of November 2026).
How many people visit Pompeii each year?
4,069,377 visited the Scavi di Pompei in 2024 and 4,000,090 in 2025. The 4.27 million figure that circulates is the four-site total of the Park.
Is there a best day of the week to visit?
No public data answers that. The Park does not publish weekday counts, and we do not infer a pattern from anecdotes.
Booking for a busy month?
Time slots and named tickets decide how smooth the entry is.
Data verified on . Park of Pompeii visitor data and 2025 financial report; MiC statistics 2023-2024; Park communiqués of 2024 and 2025. Shares are our calculation. Editorial Policy