We use strictly necessary cookies and — only with your consent — analytics cookies to improve your experience and measure how our content performs. You can accept everything, reject everything, or choose in detail. More information in the Privacy Policy and in the Cookie Policy .
Cookie preferences
Choose which categories to allow. You can change your preferences at any time from the "Manage cookie preferences" link in the site footer.
Strictly necessaryAlways on
Technical cookies essential to the operation of the site (security, and storing your own privacy choices). They cannot be disabled.
Store your personalisation choices (language, currency, layout) so your next visits are consistent.
Measure how you use the site, in aggregate form (Google Analytics 4, Core Web Vitals). They help us understand which content works.
Would serve personalised ads and measure the effectiveness of campaigns on other sites. No technology in this category is currently active: it stays here so that nothing can be switched on in future without an explicit choice by you.
Highs run from 13 °C in January to 32 °C in August, with the most rain in November. Pompeii has no official normal, so we show the two WMO stations on either side of it.
Pompeii has a Mediterranean climate with mild, wet winters and hot, dry summers. Daily highs run from about 13 °C in January to 31 or 32 °C in July and August. July is the driest month (11 to 17 mm of rain) and November the wettest (96 to 152 mm). One caveat comes first: there is no official climate normal for Pompeii itself. The site sits between a coastal station and an inland one, so we show both and let you read the range.
Why does this page use Capri and Grazzanise?
The World Meteorological Organization publishes 30-year climate normals, the standard reference for what a place is usually like. The 1991-2020 edition has 78 Italian stations. Naples Capodichino is not one of them, and neither is any station at Pompeii or on Vesuvius. The Campania stations that are there are Capri (160 m, on the rock off Sorrento), Grazzanise (9 m, on the Caserta plain about 50 km to the north-west) and Capo Palinuro, far down the coast.
Pompeii sits a few kilometers from the water, a few dozen meters above sea level, at the foot of the volcano. That puts its climate, as best we can tell, somewhere between the two: probably less windy than the island and with milder nights than the plain. We therefore print both columns. If a travel site gives you a single "Naples normal", check where it came from: the figures most often copied (a January high of 12.5 °C, a July high of 29.3 °C) are colder than both WMO stations, whose Januaries are 13.1 and 13.7 °C and Julys 30.6 and 31.7 °C.
The Bay of Naples at dusk, seen across the water toward the city and Vesuvius. · Freepik stock via Magnific, Premium license
Pompeii weather month by month
Highs and lows are monthly means of the daily maximum and minimum. Rain is the monthly total. The sea column is the mean temperature of the open Gulf of Naples from NOAA satellite data, not a beach measurement. Each pair reads Capri first, then Grazzanise.
WMO climate normals 1991-2020, Capri (160 m) and Grazzanise (9 m); sea: NOAA OISST v2.1, Gulf of Naples, 23 years.
Month
Highs, °C
Lows, °C
Rain, mm
Days with 1 mm or more
Sea, °C
Jan
13.7 / 13.1
8.7 / 3.4
71 / 89
8.3 / 8.7
15.1
Feb
14.3 / 13.8
8.2 / 3.2
58 / 71
6.8 / 8.3
14.3
Mar
16.8 / 16.2
9.8 / 5.4
53 / 83
6.7 / 7.5
14.4
Apr
19.8 / 19.3
12.1 / 7.6
40 / 67
5.5 / 7.5
15.7
May
24.4 / 23.8
15.8 / 11.4
26 / 52
3.9 / 5.6
18.8
Jun
28.7 / 28.2
19.9 / 16.1
16 / 26
2.3 / 3.1
22.7
Jul
31.7 / 30.6
22.3 / 18.5
11 / 17
1.3 / 1.9
25.4
Aug
32.4 / 31.5
23.0 / 18.9
24 / 25
1.7 / 2.3
26.2
Sep
28.3 / 27.6
19.9 / 15.9
58 / 78
5.5 / 6.0
24.5
Oct
23.5 / 23.3
16.6 / 12.2
88 / 98
6.7 / 7.9
21.9
Nov
18.3 / 18.1
12.9 / 8.3
96 / 152
9.4 / 11.3
19.3
Dec
14.6 / 14.1
9.9 / 4.6
85 / 98
8.9 / 9.6
16.8
Year
22.2 / 21.6
14.9 / 10.4
626 / 856
66.9 / 79.7
19.6
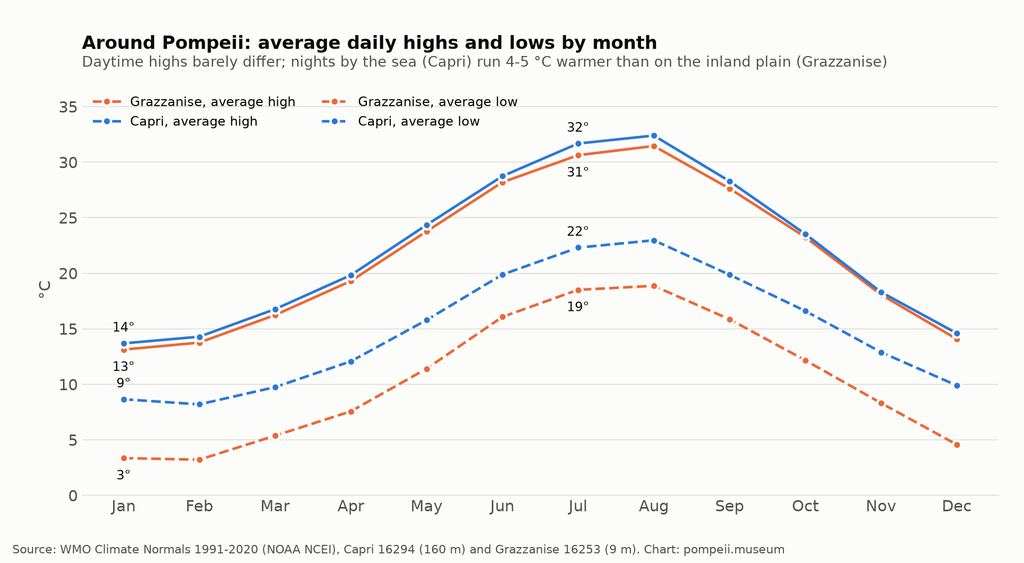
Mean daily highs and lows by month at Capri and Grazzanise. Source: WMO climate normals 1991-2020 (NOAA NCEI). · pompeii.museum, own chart from the sources cited in the caption
How cold does Pompeii get in winter?
Daytime is cool, not cold: highs of 13 to 14 °C from December to February. The difference between the two stations shows up at night. Capri's January lows average 8.7 °C, Grazzanise's 3.4 °C, so a January morning at the site can be anywhere near that range. Bring a layer you can take off by late morning. The longer treatment is on our winter page.
How hot does Pompeii get in summer?
Highs average 28 to 29 °C in June, 31 to 32 °C in July and 31.5 to 32.4 °C in August. The WMO also counts days with a high of 30 °C or above: about 19 to 23 in July and 23 to 26 in August, and 60 to 72 a year at the two stations. The WMO tables list a record daily high of 39.8 °C in July at both stations and 42.9 °C at Capri in August. The WMO tables do not count days at 35 °C or above, so we computed that from the daily Grazzanise record: at least 2.9 a year in 2000-2010 and at least 11.9 a year in 2015-2024, both lower bounds because of missing days. Our summer page turns this into hours and routes.
Humidity barely changes the picture: it averages 67 to 72 percent in summer at both stations. What makes July and August hard at Pompeii is the open ground and the lack of shade, not damp air.
When does it rain at Pompeii?
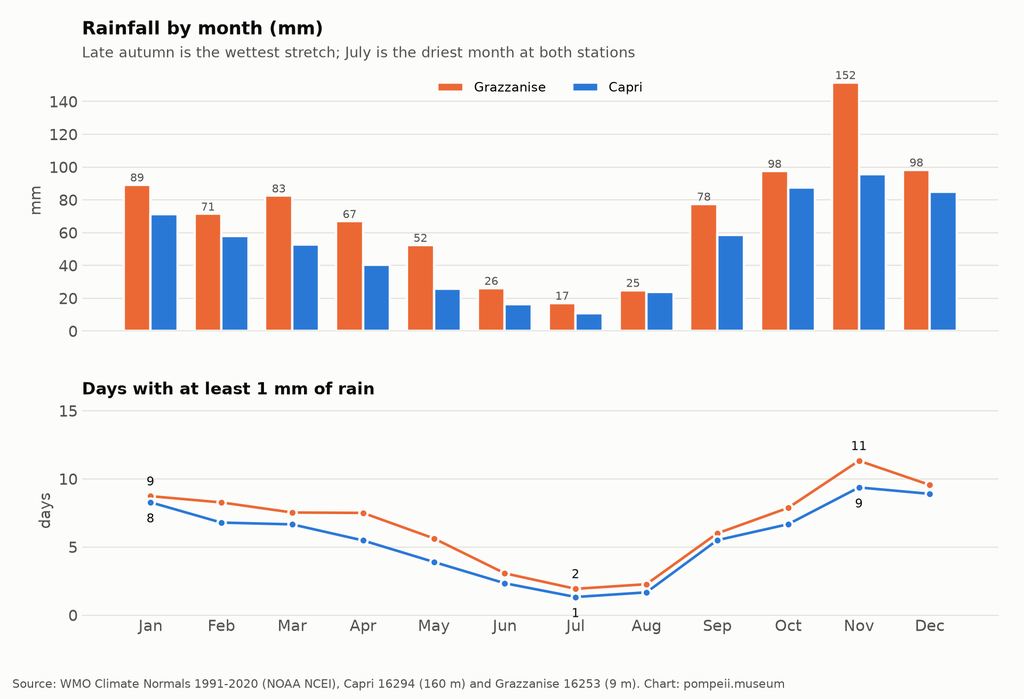
November is the wettest month: 96 mm at Capri and 152 mm at Grazzanise, with rain on 9 to 11 days. October (88 and 98 mm) and December (85 and 98 mm) follow. Spring is drier, with 26 to 52 mm in May, and July is nearly dry at 11 and 17 mm. Over a year the coast gets 626 mm and the plain 856 mm, on 67 and 80 days.
Mean monthly rainfall and days with rain at Capri and Grazzanise. Source: WMO climate normals 1991-2020. · pompeii.museum, own chart from the sources cited in the caption
Intense days are rarer: days with 10 mm or more average 19.7 a year at Capri and 28.4 at Grazzanise, with November the peak (3.3 and 5.2 days). Thunder has its own calendar. Grazzanise records thunder on 4.2 to 5.6 days a month in September, October and November, against about 2 to 3 in June to August. Capri is calmer, with 2.2 to 3.0 days in the same autumn months. For a visit, that means autumn storms are likelier than summer ones. We offer no explanation for that pattern.
Most of the site is open ground, and there is little roof. In October 2023 the Park issued a notice about wind and rough seas that told visitors not to stand under the park's trees.
Does the wind matter?
For the ruins, rarely. For the sea, a great deal. Capri counts days with wind at 10 m/s (about 36 km/h) or more: 10.6 in December and 10.0 in November, against 2.1 in August. From June to August the figure stays between 2.1 and 3.3. Grazzanise, sheltered inland, has a flat 7 to 10.5 days all year. Anyone planning the Amalfi Coast or Capri by boat between November and February should allow for disruption, and the ferry operator Travelmar says in its timetable that bad weather and sea conditions can cause delays, although it describes the service as year-round.
The Gran Cono of Vesuvius has an explicit rule: the Park of Vesuvius closes the ticket office and the path automatically from an orange alert issued by the regional civil protection office, with a refund (as of November 2026). It has no weather station in the WMO dataset, so we print no temperatures for the upper path.
How warm is the sea?
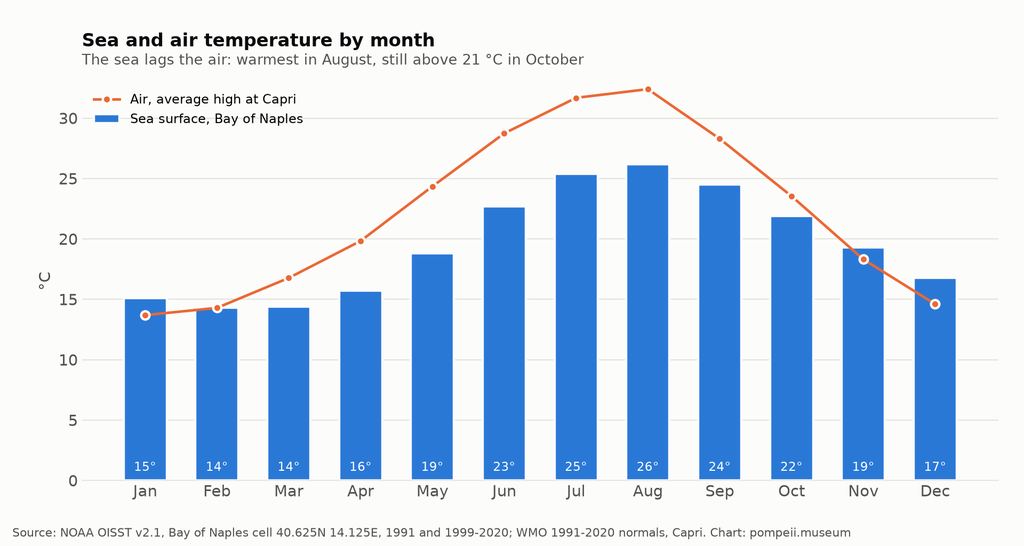
The Gulf is at its warmest in August (26.2 °C) and lowest in February (14.3 °C). Because the water holds heat, the sea is warmer than the air high from November to January: in November 19.3 °C against a Capri high of 18.3 °C. October's 21.9 °C is just under June's 22.7 °C, and November's 19.3 °C is above May's 18.8 °C. If you add a coastal day to Pompeii in late October the sea is still warm enough to swim. The most variable months from year to year are June (21.0 to 24.8 °C) and May (16.7 to 20.4 °C).
Mean sea temperature in the Gulf of Naples against the mean daily high at Capri, by month. NOAA OISST and WMO normals. · pompeii.museum, own chart from the sources cited in the caption
How much daylight do you get?
Our calculation, using the NOAA solar position method for Pompeii's coordinates, gives 15.1 hours of daylight on June 15 and 9.3 on December 15. Sunrise falls at 5:30 on June 15 and at 7:18 on December 15, sunset at 20:35 and 16:35. The Park closes at 19:00 in summer and at 17:00 in winter (as of November 2026), so on the 15th of each month from February to October it shuts before sunset, though not from 16 to 28 March or from 23 September to 14 October. Measured sunshine hours are not in the WMO tables for any of the three Campania stations, and the reanalysis models we tested run about 3 to 4 °C cold in summer, so we do not publish sunshine hours. Timetable details are on the ticket page.
What the weather means for your visit
Cold and wet: November to February. Wear waterproof shoes with grip, since the ancient pavement is uneven, and expect the site to be quiet. Mild and changeable: March, April and October, with 6 to 8 rain days a month and highs of 16 to 24 °C. Settled and warm: May and June, with the lowest rain of the shoulder season. Hot and dry: July and August, plus the early part of September. The monthly grid for the whole Bay is on the best-time page, and the crowd side of the decision is in the crowd calendar.
What we left out, and why
Scirocco. The hot southerly wind is often blamed for the worst days, but we found no station series for it in the WMO tables and do not quote one. Sunshine hours, as explained above. Ondate di calore (heat-wave bulletins): the Ministry of Health ranks cities from level 0 to 3, and we did not find a downloadable annual count for Naples, so we count hot days from station data instead. Mountain weather: no station on Vesuvius.
Weather questions
What is the weather like in Pompeii in January?
Highs of 13 to 14 °C, lows from about 3 °C on the plain to 9 °C on the coast, and rain on 8 to 9 days.
When is the rainiest month?
November: 96 mm at Capri and 152 mm at Grazzanise. October and December each bring 85 to 98 mm.
How hot is Pompeii in August?
Highs of 31.5 to 32.4 °C and lows of 19 to 23 °C. Between 23 and 26 days in the month reach 30 °C or above.
What is the weather like in Pompeii in April?
Highs of about 19 to 20 °C, lows of 8 to 12 °C, 40 to 67 mm of rain and 5 to 8 rain days. It is pleasant, though the site is busy.
Is there a weather station at Pompeii?
No official normal exists for the site. We use the WMO normals of Capri and Grazzanise, the two Campania stations on either side of it.
Why do other websites show different numbers for Naples?
Capodichino has no 1991-2020 WMO normal, so travel sites use other periods or models. The widely copied January high of 12.5 °C is colder than both WMO stations.
Does Pompeii close for bad weather?
We found no rule that shortens hours for heat. The Park has issued notices for storms and wind, asking visitors to avoid standing under trees. Check its notices on the day.
When is the sea warmest?
August, at 26.2 °C in the open Gulf, with July close at 25.4 °C and September at 24.5 °C.
Weather settled, now check the crowds
Eight years of monthly visitor counts, set against the daily cap.